
How to detect drift with Evidently and MLFlow
Learn how to detect and monitor data drift in machine learning models using Evidently and MLflow. This blog provides a step-by-step tutorial using a mobile price prediction dataset, ensuring consistent model performance by tracking and visualizing drift insights over time.


Data Drift
Data drift, also known as concept drift, refers to the change in patterns of data over time. In the context of machine learning, data drift happens when the statistical properties of the target variable, which the model is trying to predict, change in the unseen data over time.
This change in data patterns can lead to a degradation of model performance because the assumptions that the model learned during training no longer hold. For instance, a model trained to predict customer churn based on historical data may start to perform poorly if the behavior of customers changes significantly due to new market conditions or changes in the company's policies.
There are several types of data drift:
- Sudden Drift: This is when the data distribution changes abruptly. This could be due to a change in data collection, a change in policy, or a sudden shift in user behavior.
- Incremental Drift: This is a slow and gradual change in data distribution over time. It can be challenging to detect because it happens slowly.
- Seasonal Drift: This type of drift is predictable and cyclical. It's often found in data related to fields like retail, finance, and weather where there are regular and predictable changes.
Detecting data drift can be challenging because it requires constant monitoring of the model's input and output data. Some indicators of data drift include a decrease in model performance, an increase in the number of errors, or a change in the distribution of predictions.
MLflow is an open-source platform that helps manage the end-to-end machine learning lifecycle. It includes tools for experiment tracking, model packaging, reproducibility, deployment, and a central model registry. MLflow is designed to work with any machine learning library and algorithm, simplifying the management of ML projects. You can find more about MLflow on their official website.
Evidently
To keep watch on data drift, monitoring model performance and taking precautionary measures becomes a need of time. Evidently is an open source python library that helps to do most of this.
Evidently works with tabular and text data and helps throughout models lifecycle with its reports, tests and monitoring.
For data-drift detection, Evidently has a set of statistical tests and default thresholds depending on type of feature (numeric or categorical). It also allows users to define custom drift detection methods and thresholds. It produces reports that give feature level as well as dataset level data-drift insights. Reports can be visualized as html or further used as json. It also has the capability to integrate with MLops tools like Airflow, MLflow, Metaflow etc.
In this Blog, the attempt is to perform data-drift analysis on a sample dataset and to integrate the evidently output with MLflow in a custom way.
Installation and Setup
For the purpose, we need to install and import the libraries like numpy, pandas, evidently, mlflow and datetime
Dataset
For this experiment, let’s pick up the mobile price prediction dataset with limited features. Features like battery_power, clock_speed, int_memory, mobile_wt, n_cores, ram are the continuous and numerical whereas dual_sim, four_g are the categorical ones. The dataset is divided into two equal halves as reference data (df_ref) and current data (df_curr).
A drift is introduced in numeric features battery_power, ram and categorical feature dual_sim of the current dataset.
Code
Dataset and date variables are defined for the naming conventions of the drift reports and MLflow experiment / runs.
Drift analysis can be done only on the features which are common to reference and current dataset. Also the column mapping is necessary for performing suitable statistical tests to calculate drift. Columns are mapped as numerical_features and categorical_features.
We are using Dashboard with DataDriftTab to calculate covariate drift (i.e. changes in distribution of independent features). It requires reference data, current data and column mapping.
The output of the statistical test (p_value) is compared with the significance level (0.05 in this case), If it’s less than significance level then the feature is considered as drifted.
Output :
Integration with MLflow
MLflow experiment is set with the dataset name. We can log different parameters of the experiment like date/time, dataset information, number of features and their counts, the results of the drift analysis and metrics like percent of the drift features, which are easy to extract from evidently reports.
MLflow Dashboard
A new experiment gets created in MLflow and for each run parameters and metrics are logged.We can have different runs with different sets of data and also for the successive data cycles.
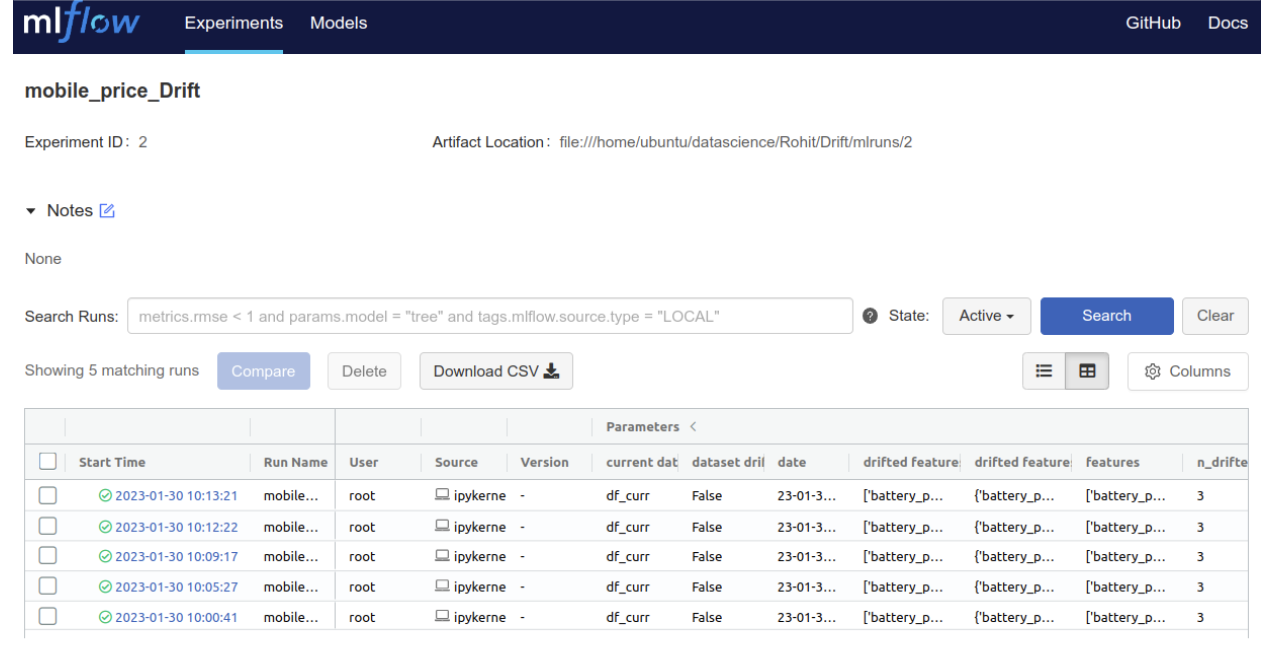
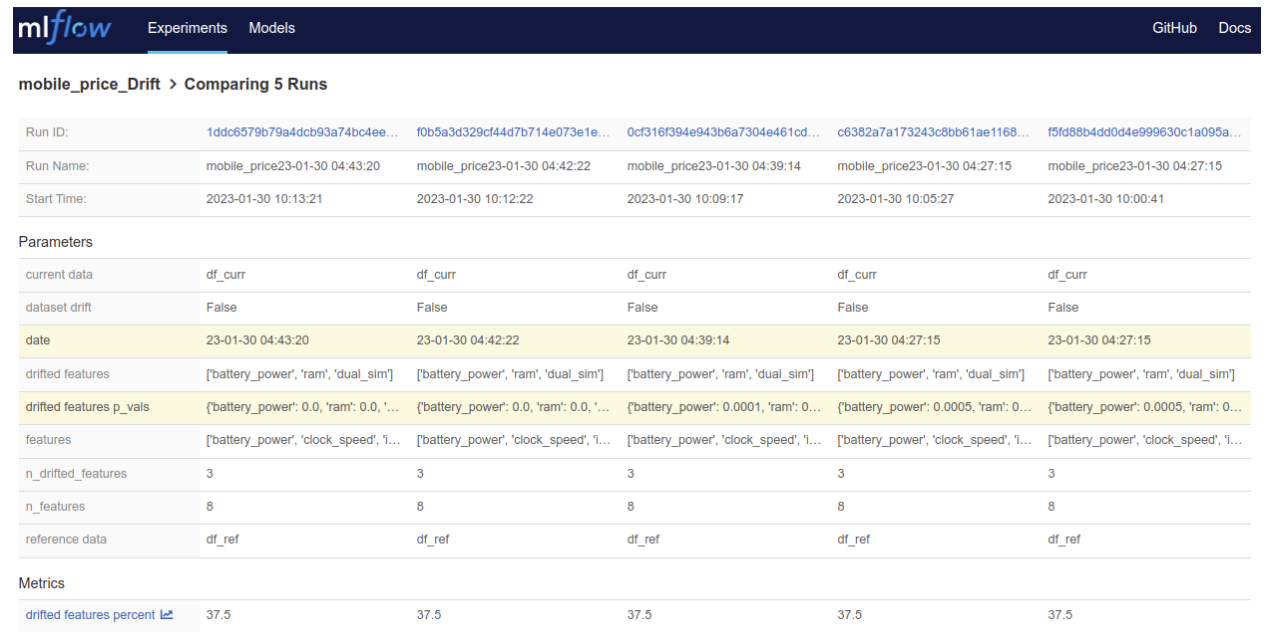
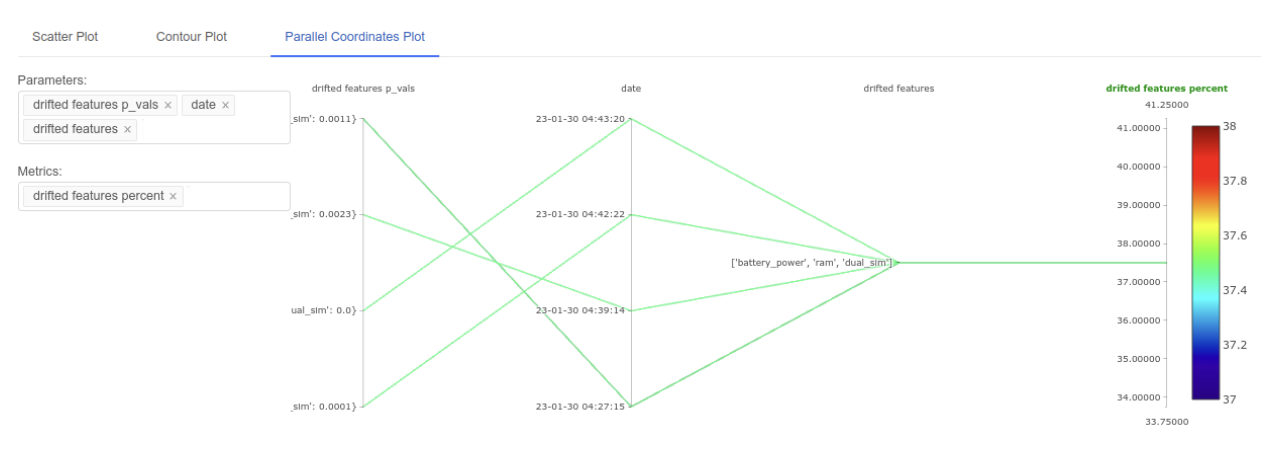
MLflow provides functionality to compare runs in tabular form as well as graphically using scatter, contour and parallel coordinate plots to keep track of data quality and drift.


No Hype. Just Systems That Deliver Real Outcomes at Scale.


A1004, Amar Business Zone, Baner, Pune, Maharashtra – 411045


