
A Comprehensive Guide: Penetration Testing with Apache JMeter
Learn how to perform effective penetration testing using Apache JMeter. This guide covers everything from installation and test plan creation to analyzing results and best practices for enhancing your application's performance and reliability.


In an increasingly digital world, All applications and services play a crucial role in our daily lives. Including online shopping to financial transactions and data management. The success of these applications depends on their performance and reliability. Penetration testing is the practice of evaluating how a system behaves under different workloads and conditions, and Apache JMeter is a powerful tool that can help you achieve this.In this blog, we will explore how to perform penetration testing using Apache JMeter.
What is Penetration Testing?
Penetration testing is a subset of software testing that focuses on evaluating application's scalability and capacity under various conditions.The primary objective of this testing is to verify the application's reliability and stability with load.
Why Use JMeter for Penetration Testing?
JMeter is primarily known open-source tool designed for performance testing, but it can be a valuable tool for penetration testing due to the following advantages:
- Open Source: JMeter is an open-source tool, which means it's cost-effective and has a strong community supporting its development.
- Platform Independent: JMeter is platform-independent and can be used on various operating systems, including Windows, macOS, and Linux.
- Versatility: JMeter is highly versatile and can handle various protocols and technologies, making it suitable for testing different types of applications.
- Scripting: JMeter allows you to create test scripts that mimic user interactions with an application. These scripts can be used to detect vulnerabilities and security flaws.
- Report generation: JMeter allows users to generate detailed reports.
Getting Started with Penetration Testing in JMeter
Let's walk through the basic steps to initiate penetration testing using JMeter:
1. Installation: Start by downloading and installing Apache JMeter on your preferred platform which is available for Windows, macOS, and Linux.
2. Creating a Test Plan: Create a new test plan that defines the scope of your penetration test. This includes the target application, user scenarios, and test objectives.To create a new test plan click on ‘File’ in the JMeter menu and select ‘New’ to create a new test plan. By default, the test plan is named "Test Plan" . It's a good practice to give it a meaningful name.
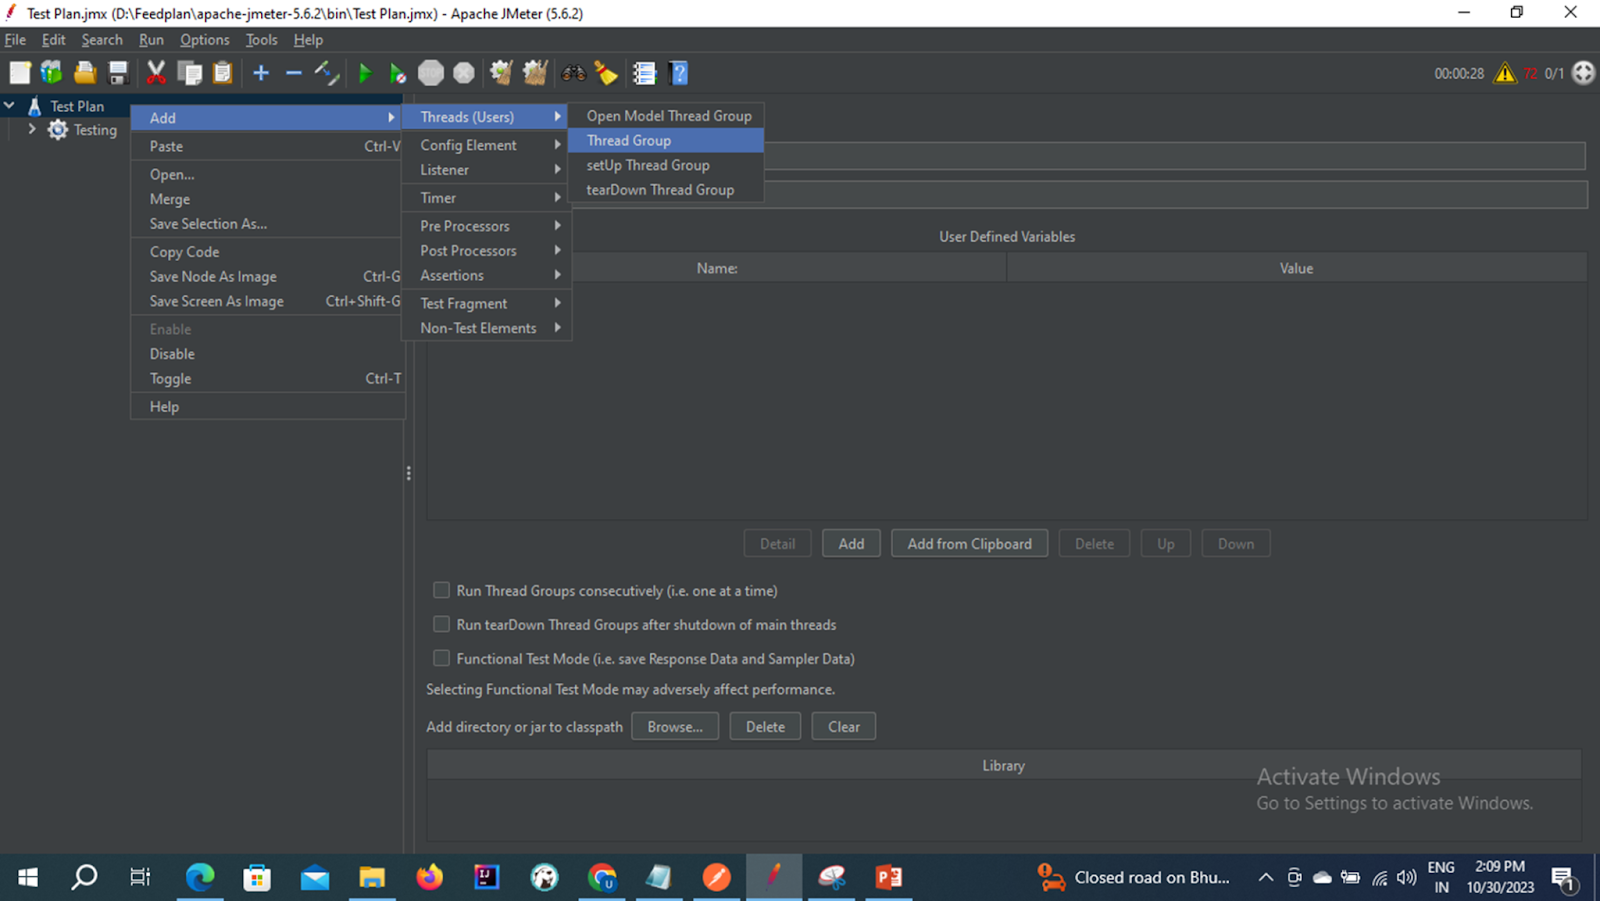
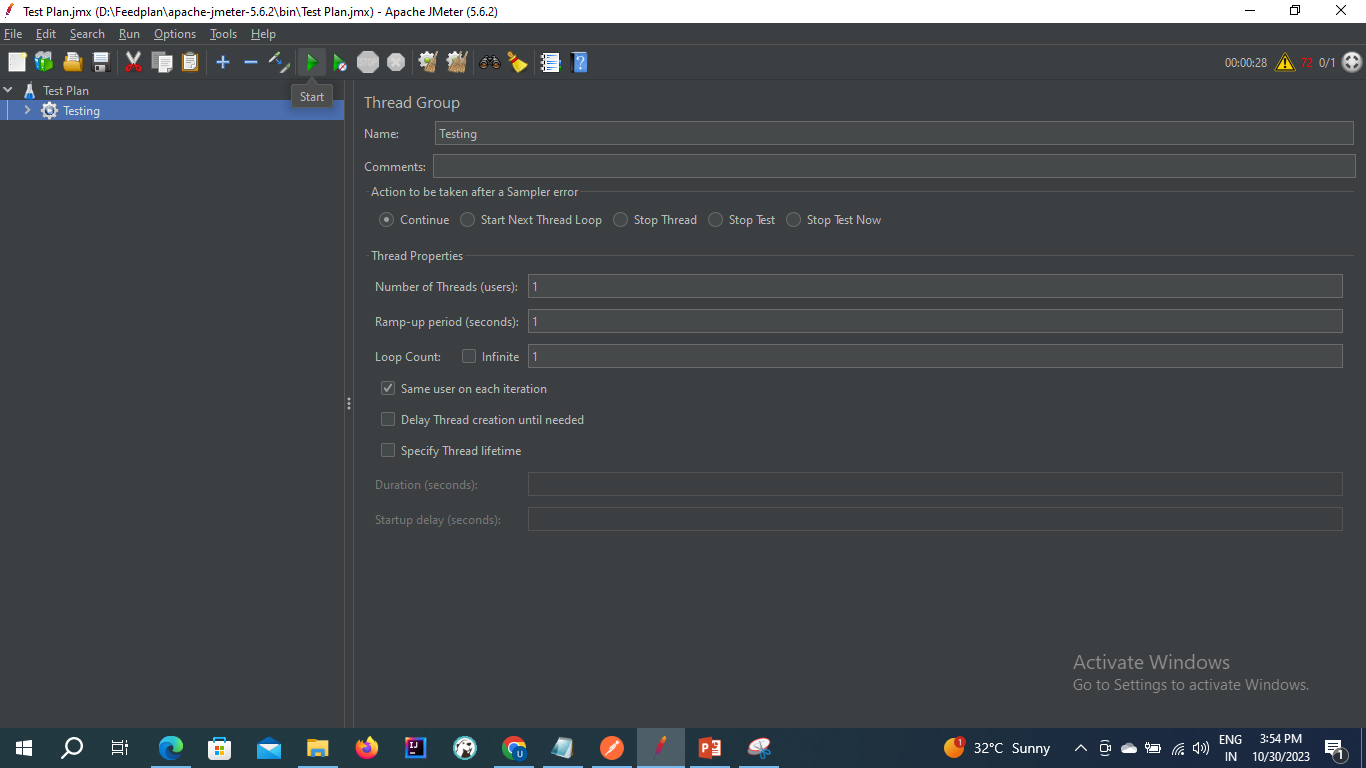
3. Adding Thread Groups: Thread groups represent virtual users or ‘threads’ that simulate real user interactions with the application. Define the number of threads, ramp-up time, and loop count to simulate different user loads. To add the thread group in the test plan follow the below steps.
- Right-click on ‘Test Plan’ in the tree view on the left.
- Select "Add" and then choose ‘Thread Group’.
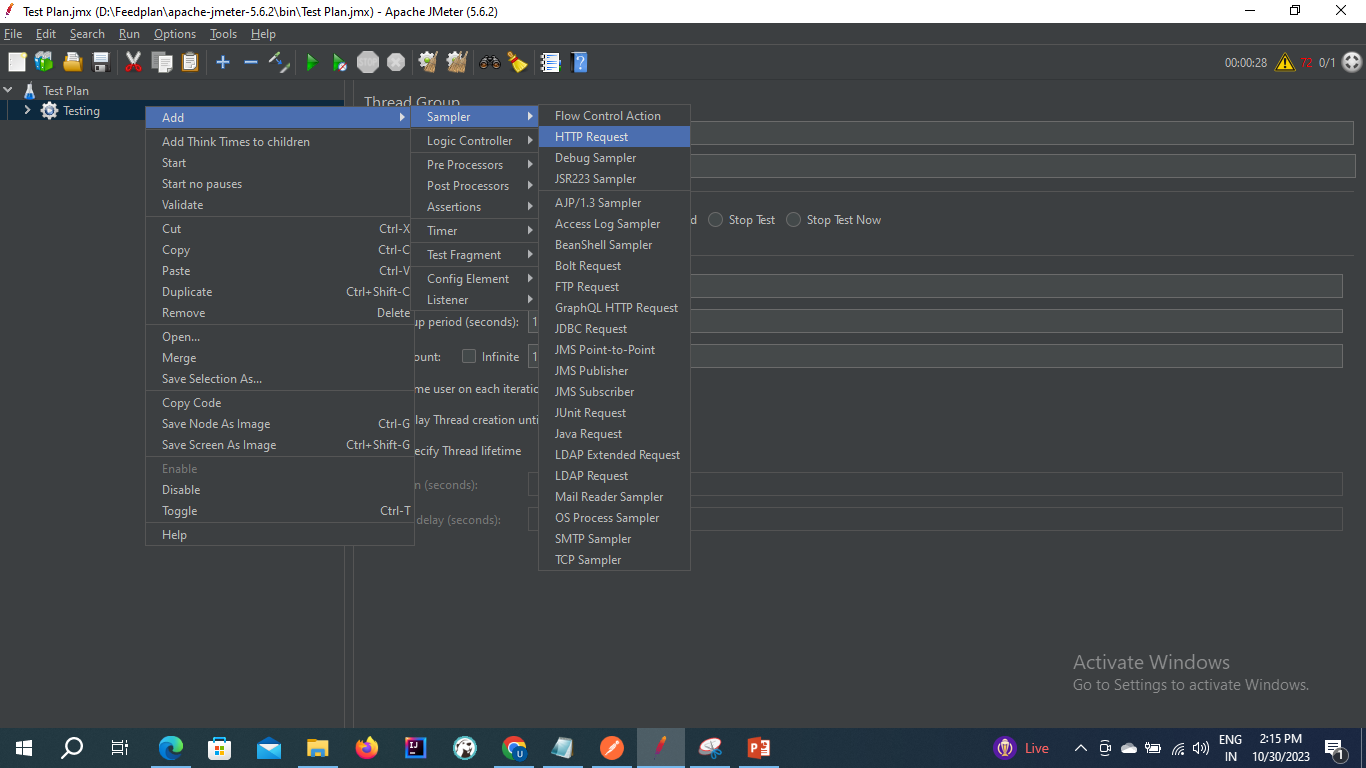
4. Configuring Samplers: Samplers in JMeter define the type of requests you want to send to the application. Commonly used samplers include HTTP Request (for web applications), JDBC Request (for database queries), and FTP Request (for file transfers). To add the sampler in the thread group follow the below steps.
- Right-click on the newly added ‘Thread group’.
- Select ‘Add’ and then choose ‘Sampler.’
- Choose ‘HTTP Request’ to create an HTTP request that represents a user action.
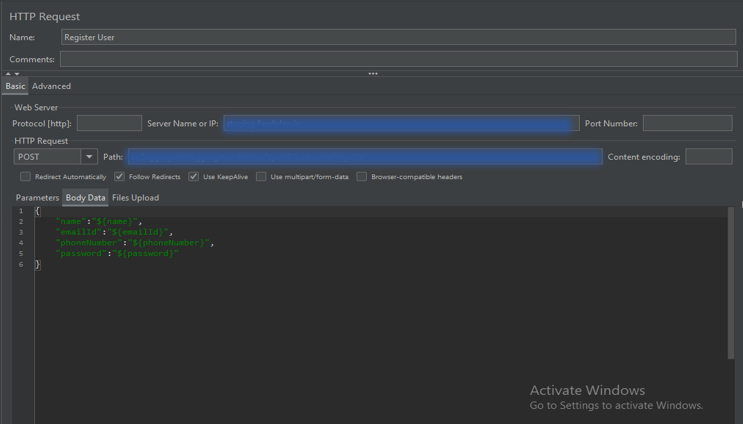
5. Configuring HTTP request: you can configure the HTTP Request sampler with the details of the web page or API endpoint you want to test. The configuration options include:
Protocol: Choose the HTTP or HTTPS protocol, depending on your application's URL.
Server Name or IP: Enter the domain name or IP address of the web server where your application is hosted. You can also use variables or parameterization to make this dynamic.
Port Number: Specify the port number for the web server. The default HTTP port is 80, and the default HTTPS port is 443.
Method: Choose the HTTP request method (GET, POST, PUT, DELETE, etc.) appropriate for your test scenario.
Path: Enter the URL path for the request, which specifies the resource or endpoint you want to access on the server.
Parameters: Add any request parameters if necessary. You can specify parameters as key-value pairs.
Header Manager: You can add custom HTTP headers to the request by configuring the Header Manager, which can be added under the HTTP Request sampler.
Body Data: If you're making POST or PUT requests and need to send data in the request body (e.g., for API calls), you can enter the request body data here.
Authentication (Optional): If your application requires authentication, you can configure it by using the ‘HTTP Authorization Manager’ or by adding parameters to the HTTP Request sampler.
You can add multiple HTTP requests under a single thread group to simulate different user actions.
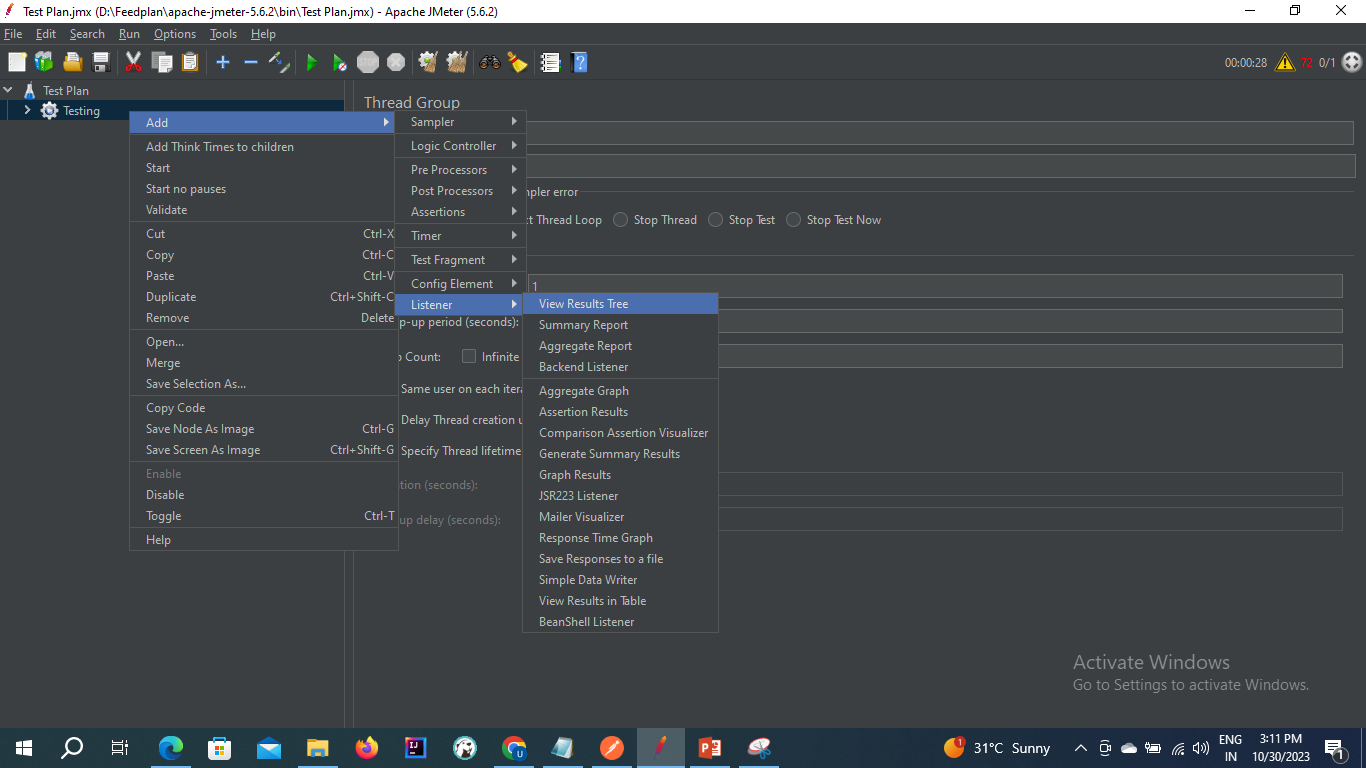
6. Adding Listeners: Listeners display the results of your test in various formats, such as tables, graphs, and logs. Use listeners to monitor and analyze the test results.To add a listener follow below steps.
- Right-click on the ‘Thread group’.
- Select ‘Add’ and then choose ‘Listener’.
- Choose the appropriate listener for your reporting needs, such as ‘View Results Tree’ or ‘Summary Report.’
You can add multiple listeners in a single thread group to generate various reports.
7. Running the Test: Once your test plan is configured completely, you can start the test and observe how the application performs under different user loads.Before that you need to save the test plan, please follow the below steps to save your test plan.
- Click on ‘File’ in the JMeter menu.
- Select ‘Save Test Plan’ to save your test plan to a .jmx file.
To run the test plan click the green ‘Run’ button on the toolbar. You can choose various options for running the test, such as the number of threads (virtual users) and the test duration.
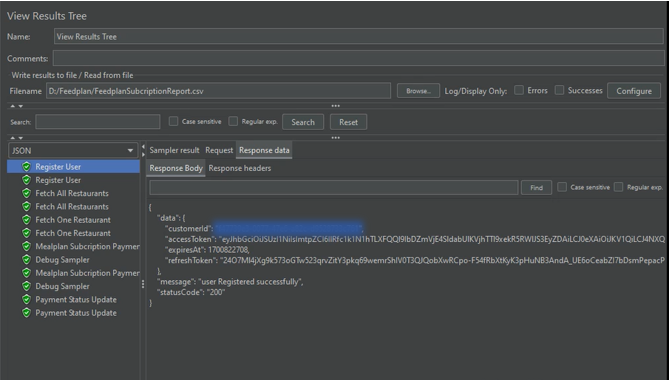
8. Analyzing Results: After the test is complete, analyze the results to identify performance bottlenecks, response times, errors, and other important metrics. JMeter provides various built-in listeners for this purpose. Here I am sharing ‘View Results Tree’ and ‘View Result in Table’. View Results Tree displays detailed information about each executed request in a tree-like structure. It shows request and response data, response times, and other details.
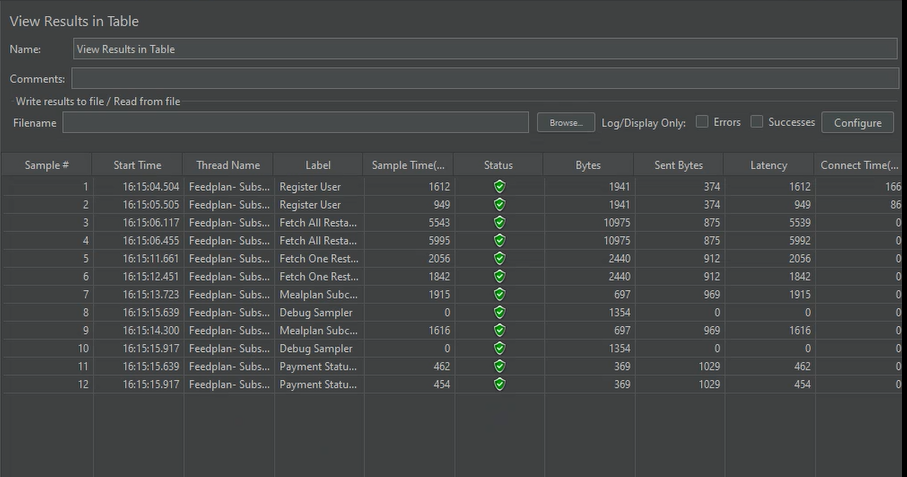
The View Results in Table listener provides a tabular view of the sample results, showing details like response times, response codes, and data size.
9. Exporting Results: JMeter allows you to export test results in various formats, including CSV and XML. You can use these exported results for further analysis, sharing with team members.These reports are crucial for analyzing test results and identifying performance of the application.
Best Practices for Penetration Testing with JMeter
Create Realistic Scenarios: Your test scenarios should closely mimic how real users interact with the application.
Data Parameterization: Use variables and data files to parameterize your test and simulate a variety of user inputs.
Distributed Testing: Consider distributed testing to simulate higher loads and achieve more accurate results.
Testing with various conditions:
- It involves testing the application under normal and peak load conditions.
- The application should be tested by gradually increasing the load to assess how it scales.
- Provide the loads beyond its maximum capacity and observe the application behavior.
- The application should be tested by running tests for hours, days to check the application behavior under sustained load for an extended period.
- The application should be tested with numerous users or tasks working concurrently.
- Each component should be tested independently and with integration to ensure it meets expectations.
Regular Testing: Penetration testing is not a one-time event. You have to conduct regular tests to account for changes in your application and evolving threats.
Conclusion
Penetration testing is an essential step in scalability and reliability of applications. Apache JMeter is renowned for its prowess in performance testing, it can also be effectively applied to penetration testing. By utilizing JMeter's you can identify and address stability, data consistency, Response times, error rates and performance related issues, which can be helped to optimize your system or application, and provide a better user experience. This proactive approach will help you strengthen your application and ultimately deliver a seamless and satisfying user experience.


No Hype. Just Systems That Deliver Real Outcomes at Scale.


A1004, Amar Business Zone, Baner, Pune, Maharashtra – 411045


